Alex Herrera Brietzke

B.A. Digital Marketing
During my graduate studies my interest for data analysis and vizualisation has grown significaly.
This portfolio serves as a showcase for the most important projects developed till the date.
Portfolio
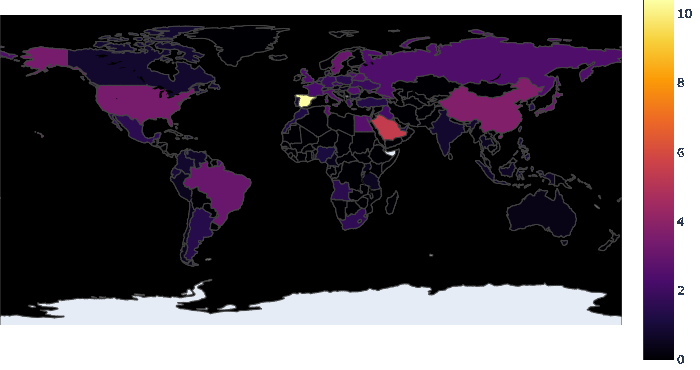
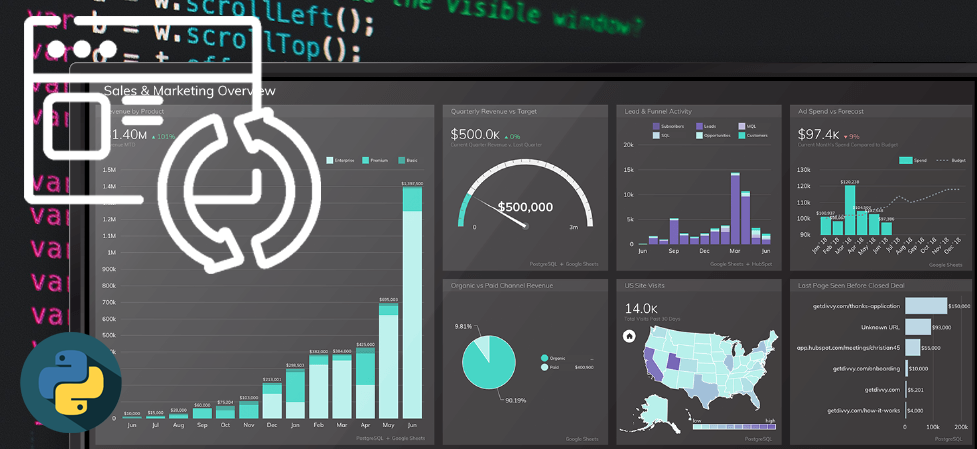
Dash App: Interactive Instagram Followers World Map for different Accounts
Interactive Web App that shows followers distribution around the globe for different Instagram accounts in form of a Choropleth map. These four accounts belong to the same company tho. The App is developed and tested in a Jupyter Notebook locally.
Demand Forecasting with Machine Learning: Predicting NYC CitiBike montlhy trips with IBM AutoAI (Watson Studio)
Demand forecasting is critical to businesses and institutions because it utlimately defines profitability and accurate future scenarios. The integration of the IBM Mashine Learning Model for this project followed this process:
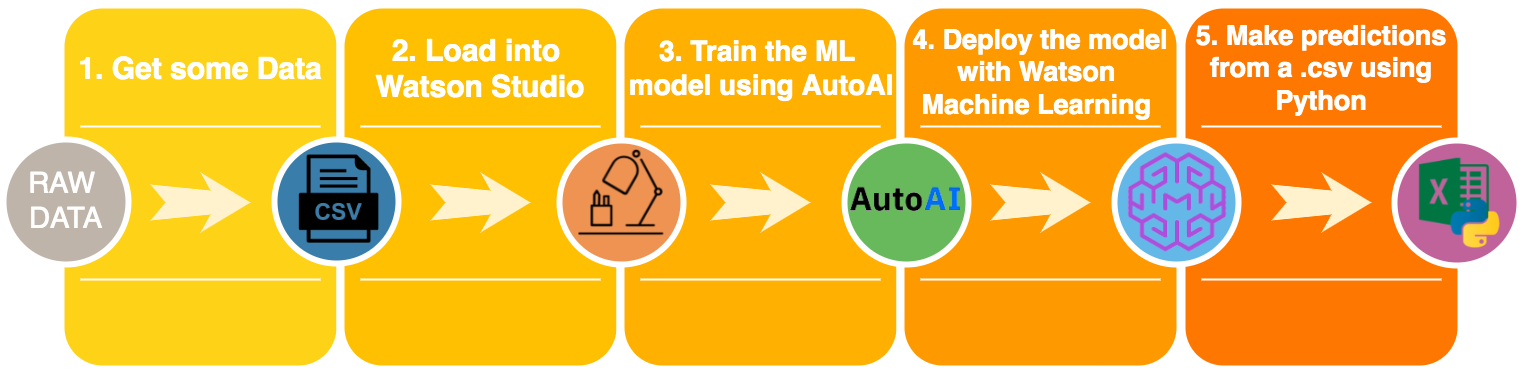
- Data manipulation and aggregation with Python in a Jupiter Notebook.
- Set-up account at IBM Cloud and upload data to a new project.
- Select the AutoAI with Regression Machine Learning Model.
- Save the ML Model and create a deployment of a Rest API.
- Create a Python script for the automation.
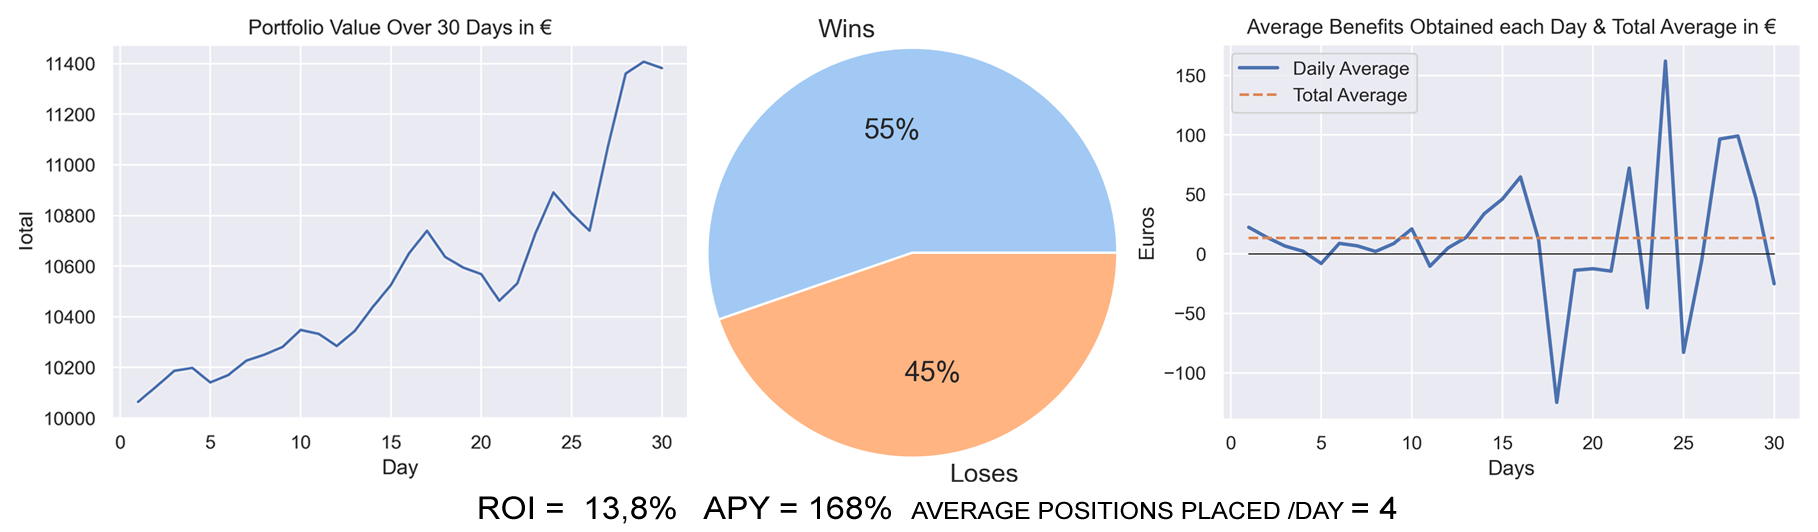
RESULTS

BTC/EUR Trading Strategy: Demo Account Data Analysis over 30 Days
I decided to set up a 10.000€ demo account in Binance and test a trading strategy for the 1 minute Bitcoin Chart. The data was gathered and calculated on Google Sheets. The startegy was based on the following algorithm (always counting a 1.5 risk/benefit Ratio).
In order to place a long position, following condition should be met:
- BTC Price + 20MA Indicator > 200MA Indicator
- Stochastic RSI CrossUp Event under the 20% Zone
- 2x Green Supertrend Indicators
In order to place a short position, following condition should be met:
- BTC Price + 20MA Indicator < 200MA Indicator
- Stochastic RSI CrossDown Event over the 80% Zone
- 2x Red Supertrend Indicators
URL Refresher: Python script reloading every minute a specific URL
During my period at Innovation Group, our team live production was broadcasted in 2 different TVs during the working hours. The main problem was that someone had to refresh the website every time we wanted to see updated data. As an IT assistant I came up with the idea of creating a python script to automated the process of opening the url, loging in and reloading the website.
Bachelor Thesis: Extensive green roofs as an air pollution abatement strategy in Barcelona
This study encompasses published research to date on how green roofs can help mitigate pollution and quantifies the level of air pollution removal of extensive green roofs in two possible future scenarios in the Barcelona urban center. The focus was laid down on pollutants with health-threatening levels during the year 2020. A dry deposition model like the i-Tree Eco software was used to estimate how much pollution can be absorbed. This research suggests green roofs have the potential to play a key role in the development of sustainable cities, and as a result, they should be widely employed and promoted as instruments in urban planning and policies towards a climate friendly future.
Figure 2.9. PM10 24h average levels in Barcelona’s air measurement stations from April 2019 to April 2021
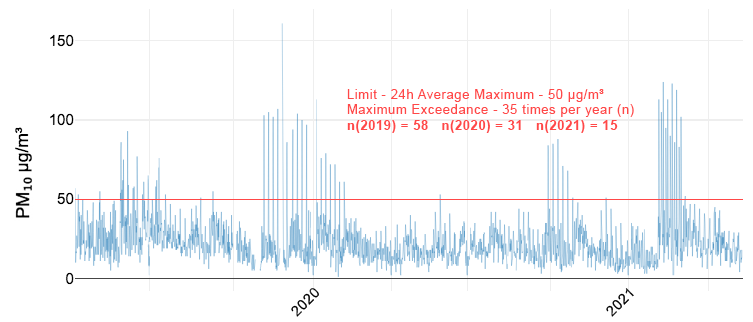
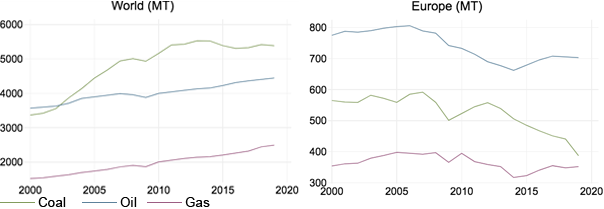
Figure 1.2. Fossil fuels consumption from 2000 to 2019 (MT: Megatonnes)